Highest-Risk US Cities for Motorists
Driving safety in the United States is not uniform across metropolitan areas. While individual driving behavior is a critical factor, regional infrastructure, traffic enforcement levels, and local demographic shifts create varying degrees of risk. Understanding the "fatality rate per 100,000 residents" provides a professional benchmark for assessing urban safety. For travelers and commercial operators, identifying these high-risk zones is essential for adjusting defensive driving tactics and route timing.
| Urban Fatality Metrics: High-Risk Zones | |
|---|---|
| Fort Lauderdale, FL | Fatality rate: 22.39 per 100k residents |
| Little Rock, AR | Fatality rate: 17.94 per 100k residents |
| San Bernardino, CA | Fatality rate: 17.12 per 100k residents |
| Risk Correlation | High density of tourism and environmental volatility |
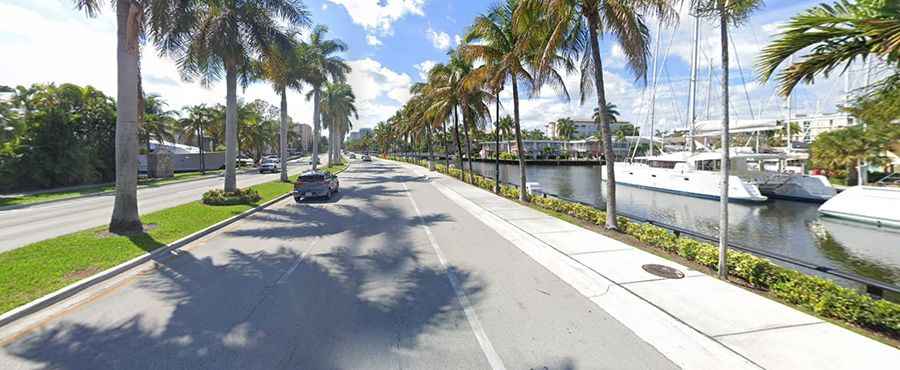
Why does Fort Lauderdale rank as one of the most dangerous US cities?
With a staggering fatality rate of 22.39 per 100,000 people, Fort Lauderdale presents a unique set of logistical challenges. This high rate is attributed to a combination of factors: a dense influx of tourists unfamiliar with local road configurations, a significant senior driving population with varied reaction times, and seasonal spikes in impaired driving during major holiday periods. The confluence of high-speed urban boulevards and complex maritime-adjacent infrastructure increases the probability of multi-vehicle collisions.
How do environmental conditions impact safety in Little Rock?
Despite having a population of less than 200,000, Little Rock records a high fatality rate of 17.94 per 100k. Arkansas is statistically prone to high-risk motoring during adverse weather events, particularly heavy precipitation. The region’s asphalt surfaces often struggle with drainage, leading to sudden hydroplaning incidents. For professional drivers, navigating the intersections of Little Rock requires heightened situational awareness and a reduction in velocity during any storm system to compensate for the localized infrastructure limitations.
Is San Bernardino more dangerous than Los Angeles for drivers?
Statistically, San Bernardino surpasses larger hubs like Los Angeles in terms of fatality risk per capita, with a rate of 17.12. This is often a surprise to travelers who associate danger strictly with traffic volume. In San Bernardino, the risk is driven by a mix of high-speed transit corridors and surface street congestion. The city serves as a critical logistics hub for freight, meaning passenger vehicles must share the road with high-density commercial traffic, increasing the severity of any potential collision.
How can motorists avoid becoming a statistic in high-risk cities?
Safety in dangerous urban zones is a matter of operational discipline. Professional protocols suggest:
- Pre-Transit Research: Familiarizing yourself with local traffic regulations and identifying high-frequency accident intersections.
- Velocity Control: Adhering strictly to speed limits, as most urban fatalities are linked to excessive speed in congested areas.
- Vigilant Observation: Maintaining a 360-degree awareness of other motorists, particularly in areas with high tourist or transient populations.
Conclusion: The Necessity of Urban Situational Awareness
The danger level of a city is rarely obvious from its skyline. By analyzing fatality rates and understanding the environmental and demographic forces at play, drivers can better prepare for the specific challenges of cities like Fort Lauderdale or San Bernardino. On the roads of America, the difference between a safe arrival and a fatal incident often depends on a driver’s ability to recognize and adapt to the unique risks of the urban landscape.