15 Most Dangerous Cities for Driving in the USA
Quantifying road safety in major metropolitan areas requires a deep dive into federal collision data. This analysis identifies the cities with the highest per capita vehicular fatalities, serving as a critical barometer for driver and pedestrian risk. Utilizing the most recent data from the National Highway Traffic Safety Administration (NHTSA), specifically the Fatality Analysis Reporting System (FARS), we have ranked U.S. cities with populations over 150,000 to determine where the risk is most concentrated.
| High-Risk Geography: Key Findings | |
|---|---|
| Primary Regional Hazard | The Southeastern U.S. (Florida overrepresentation) |
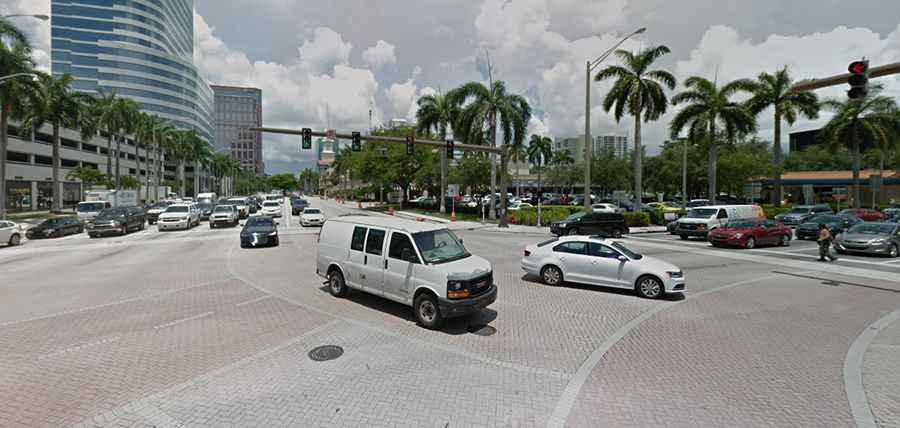
| Highest Fatality Rate | Fort Lauderdale, FL (22.39 per 100k) |
| Pedestrian Risk Hub | Pittsburgh (50% of total fatalities) |
| Total Volume Leader | Los Angeles (293 annual fatalities) |
Geographically, the South remains overrepresented in high-risk categories. A full one-third of the cities on this list are located in Florida. Experts attribute this disparity to a "high-risk demographic mix": a large volume of tourists navigating unfamiliar territory, a high proportion of senior citizens with varying reflex speeds, and seasonal "spring breakers." Additionally, infrastructure in these rapidly growing hubs often struggles to keep pace with the volume of high-speed urban transit.
The 15 Most Dangerous Cities Ranked by Fatality Rate
The following cities ranked the worst based on total fatality rates per 100,000 residents:
- Fort Lauderdale, Fla. – Fatality Rate: 22.39 | Pedestrian Fatalities: 24.4%
- Orlando, Fla. – Fatality Rate: 19.95 | Pedestrian Fatalities: 10.9%
- Augusta-Richmond Co., Ga. – Fatality Rate: 19.57 | Pedestrian Fatalities: 15.8%
- Little Rock, Ark. – Fatality Rate: 17.94 | Pedestrian Fatalities: 26.5%
- San Bernardino, Calif. – Fatality Rate: 17.12 | Pedestrian Fatalities: 15.8%
- Salt Lake City, Utah – Fatality Rate: 16.51 | Pedestrian Fatalities: 26.7%
- Chattanooga, Tenn. – Fatality Rate: 16.39 | Pedestrian Fatalities: 17.9%
- Jackson, Miss. – Fatality Rate: 15.53 | Pedestrian Fatalities: 18.5%
- Memphis, Tenn. – Fatality Rate: 15.08 | Pedestrian Fatalities: 11.9%
- Lubbock, Texas – Fatality Rate: 14.97 | Pedestrian Fatalities: 15.2%
- Jacksonville, Fla. – Fatality Rate: 14.36 | Total Fatalities: 116
- St. Petersburg, Fla. – Fatality Rate: 14.27 | Pedestrian Fatalities: 28.6%
- Tulsa, Okla. – Fatality Rate: 14.00 | Pedestrian Fatalities: 18.5%
- Birmingham, Ala. – Fatality Rate: 13.55 | Total Fatalities: 31
- Oklahoma City, Okla. – Fatality Rate: 13.41 | Total Fatalities: 74
The Safest Urban Environments
On the opposite end of the spectrum, these 10 cities and regions show the lowest fatalities per 100,000 population, often due to aggressive traffic calming measures and superior public transit infrastructure:
- Arlington CDP, Va. (0.48)
- Vancouver, Wash. (1.23)
- Moreno Valley, Calif. (1.57)
- Rochester, N.Y. (1.93)
- Spokane, Wash. (1.98)
- Lincoln, Neb. (1.99)
- Aurora, Ill. (2.33)
- St. Paul, Minn. (2.50)
- Omaha, Neb. (2.51)
- Jersey City, N.J. (2.90)
Conclusion: Infrastructure vs. Human Factors
While regional factors like Florida’s demographics play a role, infrastructure remains the deciding factor in urban safety. Cities that prioritize pedestrian-safe zones and lower-speed urban corridors—such as Arlington or Vancouver—consistently outperform higher-speed, car-dependent metros. For drivers, situational awareness in these "top 15" high-risk cities is paramount to mitigating the statistical probability of a collision.