The Desert Risk: Analyzing Traffic Fatality Patterns in High-Density Arid Regions
Analyzing traffic safety in arid, high-growth regions reveals a disturbing paradox: even when road infrastructure is modern, fatality rates can surge due to environmental stress and driver behavior. Using Arizona’s Maricopa County as a primary case study—a region that consolidates over 60% of the state’s population—we can identify critical risk factors that apply to high-traffic desert corridors worldwide. From thermal stress to the psychological impact of "empty road" syndrome, understanding these patterns is essential for long-distance expedition safety.
| Case Study Metrics: High-Density Arid Zones (2021) | |
|---|---|
| Primary Data Source | Arizona Department of Transportation (ADOT) datasets. |
| Fatality Trend | 6% increase in fatal crashes despite overall traffic reduction. |
| Risk Demographic | Males (68.3% of fatalities), primarily in the 25-34 age range. |
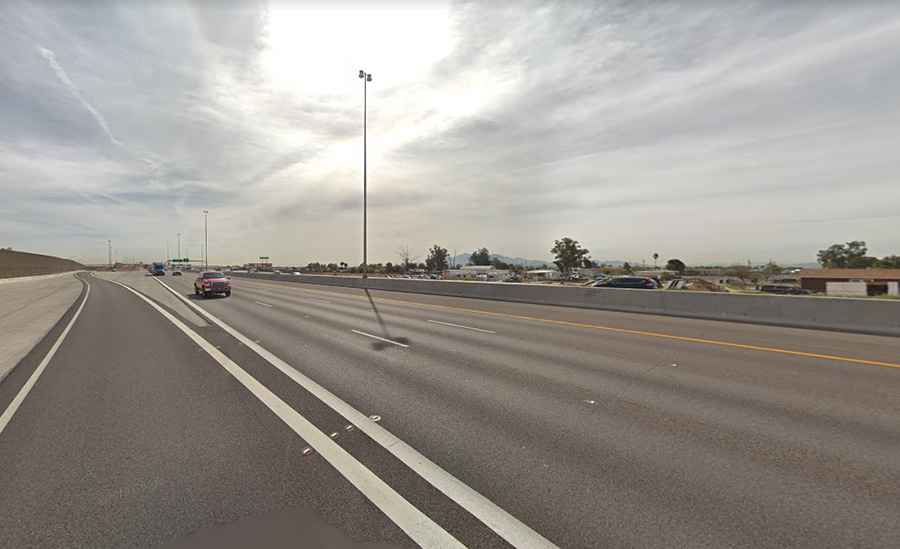
The Pandemic Paradox: Why Empty Roads Became Deadlier
Data from recent years highlights a shocking global trend: as traffic volume decreased during the 2020-2021 period, the severity of accidents increased. In Arizona, total collisions dropped by 24%, yet fatal crashes rose by 6%. Public safety experts attribute this to reckless behavior on near-deserted roadways. For the transcontinental driver, this serves as a warning: lower traffic density often encourages higher speeds and reduced vigilance, leading to high-impact collisions even on well-maintained surfaces.
Demographic Analysis: Who is Most at Risk?
The statistics reveal a clear pattern in victim demographics that transcends borders. Men are significantly more likely to be involved in fatal incidents, accounting for over 68% of deaths. The most vulnerable age group is the 25-34 range. This suggests that experience and risk perception are the primary factors in desert driving safety. Younger drivers, often feeling more confident on straight, open roads, are more susceptible to the catastrophic errors caused by high-speed maneuvers.
The Concentration of Risk in Urban Deserts
In regions like Maricopa County, which accounts for over 71% of a state's total accidents, the concentration of risk is extreme. While rural roads are often more technically challenging, the sheer volume of high-speed urban traffic in hot climates creates a unique danger zone.
- Alcohol Impairment: Alcohol remains a top cause of fatal crashes in these hubs. In our case study, one single county recorded over 100 fatal alcohol-related incidents, significantly higher than the rural average.
- Economic Impact: The financial cost of these crashes is staggering, with billions of dollars lost in damages—a reminder that traffic safety is a critical pillar of regional stability.
Environmental Factors: Heat and Visibility
Arid regions present specific environmental challenges that affect safety. Extreme heat can lead to tire delamination and engine cooling failures, while the intense glare of the desert sun reduces a driver's perception of colors and stoplights. When alcohol is added to these natural stressors, judgment and reaction times are impaired far beyond the levels seen in more temperate climates.
Conclusion: Tactical Awareness in Arid Zones
Whether you are driving through the American Southwest, the Middle East, or the Australian Outback, the data remains consistent: high-density corridors in arid climates require a defensive driving mindset. Pay attention to the road, stay hydrated to maintain cognitive function, and never underestimate the danger of a "clear" road. Safety in the desert is not just about the vehicle—it is about the discipline of the driver.