Exploring the Statistics Behind Motorcycle Crashes in the United States
Riding a motorcycle offers unparalleled freedom and mechanical connection to the road, but it comes with a significantly higher risk profile than any other form of motor vehicle transport. Without the structural protection of a vehicle frame, riders are directly exposed to impact forces. Analyzing the statistical patterns of crashes is essential for developing better defensive driving strategies on both urban and remote routes.
| U.S. Motorcycle Safety Statistics | |
|---|---|
| Total Registered Units | ~8.32 Million (and rising) |
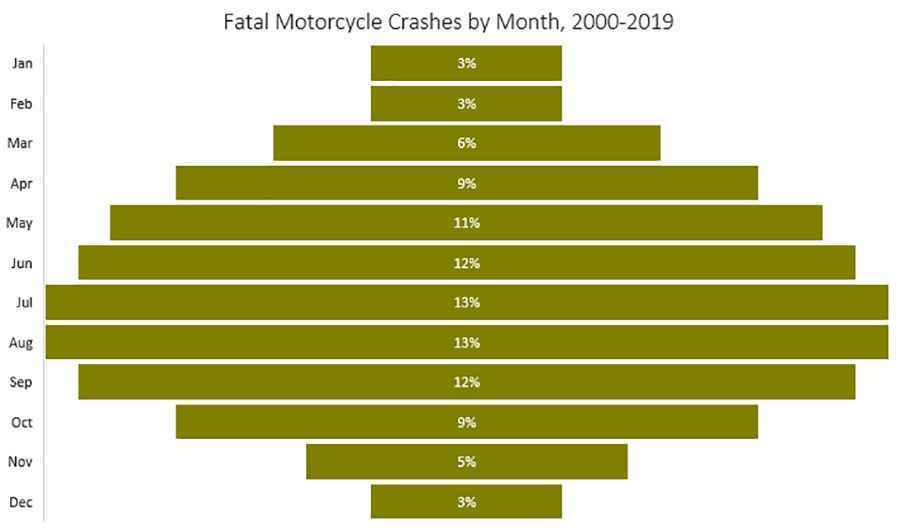
| Peak Risk Season | May to September (61% of fatalities) |
| Helmet Effectiveness | 37% for riders / 41% for passengers |
Temporal Dynamics: When Do Fatalities Occur?
An overwhelming 61% of fatal crashes occur between May and September. Contrary to popular belief, most lethal incidents happen during daytime hours and in clear weather, coinciding with peak recreational riding periods. Visibility and high rider volume during summer months are the primary factors behind these figures.
The "Proximity Trap": Why Most Crashes Occur Near Home
Statistical analysis shows a startling trend: over half of all fatal motorcycle accidents (58%) occur within a 10-mile radius of the rider’s home. High-conflict urban zones, such as intersections, are where motorcycles are most frequently overlooked by other motorists. Additionally, riders often exhibit less vigilance on short, familiar trips.
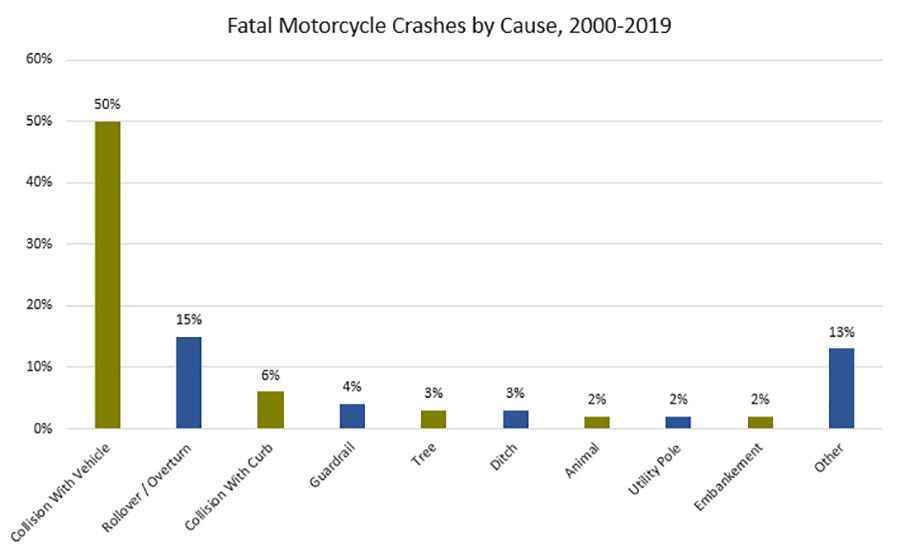
Collision Taxonomy: Multi-Vehicle vs. Solo Crashes
Multi-vehicle accidents account for approximately 50% of all recorded incidents. The second most common factor is the bike rollover, often triggered by improper braking or road surface irregularities such as gravel, potholes, or sand, which are particularly hazardous for two-wheeled vehicles.
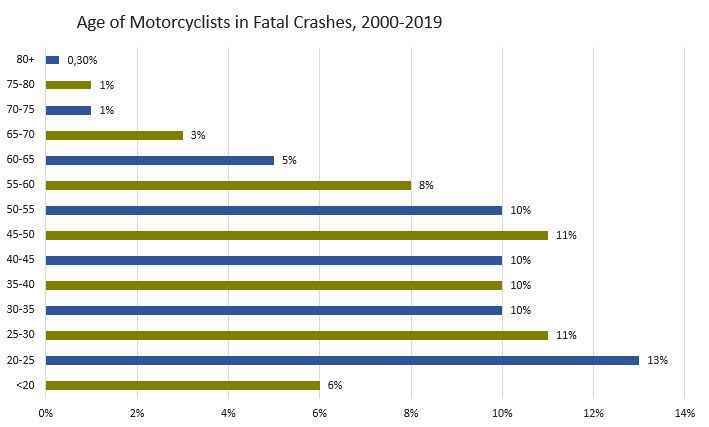
Demographics and Vulnerability
While the 20-25 age range remains highly vulnerable, there has been a significant 33% increase in fatalities among riders aged 40-60. Statistically, 96% of riders killed in accidents are male. This shift is often attributed to older riders returning to motorcycling with high-displacement bikes without recent training.
Technical Efficacy of Protective Gear
DOT certified helmets are estimated to be 37% effective in preventing fatalities. Despite this, roughly 40% of riders killed in recent years were not wearing a helmet at the time of impact. In the absence of airbags and crumple zones, technical gear is the only line of defense against road rash and internal trauma.
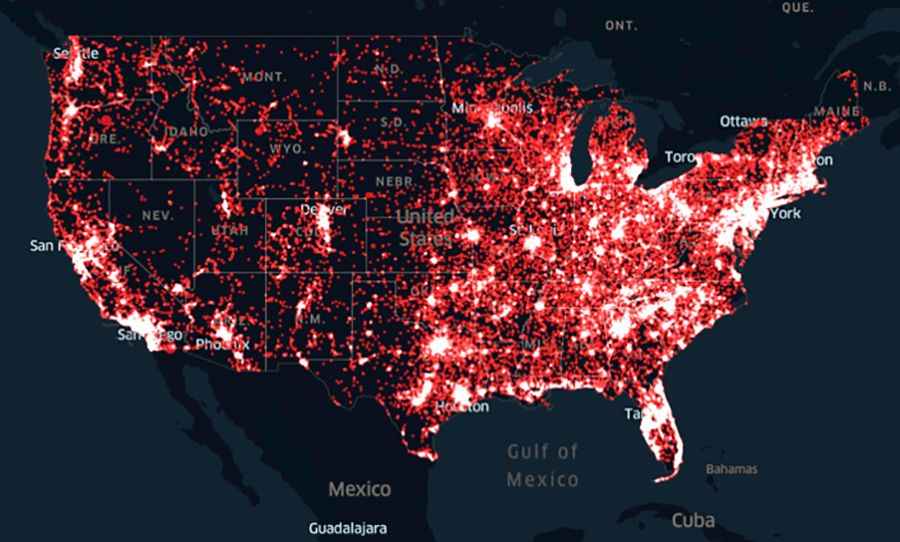
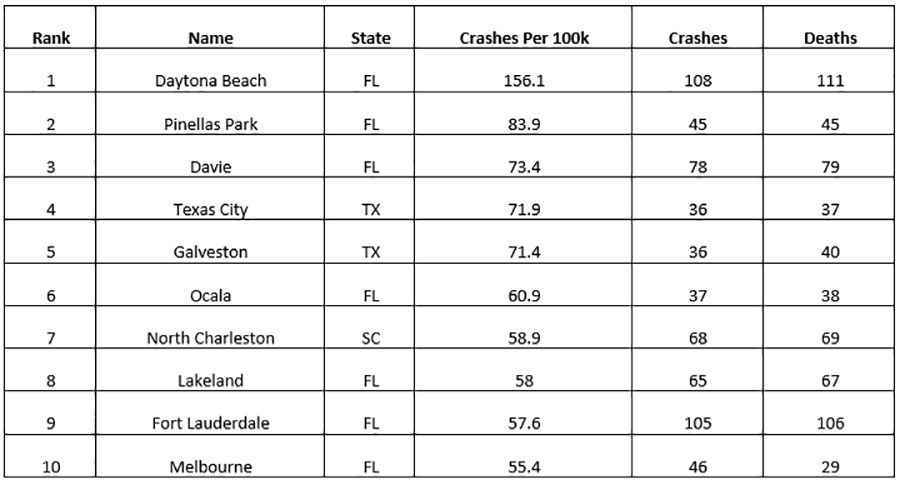
Geographic Hotspots: The Florida and California Factor
Florida and California dominate the list of high-risk zones due to their high registration numbers and year-round riding weather. Events like Daytona Beach Bike Week significantly spike the per-capita crash rate, which can reach nearly double the national average in these specific hotspots.
Conclusion
On the world's most dangerous roads, the margin for error on a motorcycle is zero. Proper gear, situational awareness, and an understanding of these crash statistics are the most effective tools for reducing the odds of a fatal encounter.