How Safe is it to Drive in the State of Texas?
Over the years, Texans have become known for their resilience, hardworking nature, and self-sufficiency. The state’s population has steadily grown over recent years as a result, with a steady flow of people moving to the area to take advantage of work opportunities and the local culture.

With an estimated 29,945,493 residents in 2022, Texas has the second-largest population in the entire United States. However, such a large population inevitably means lots of drivers on the roadways, particularly around large cities. We thus wanted to see how safe (or dangerous) it is to drive on Texas roadways.
What Were Texas’s 2021 Statewide Crash Rates?
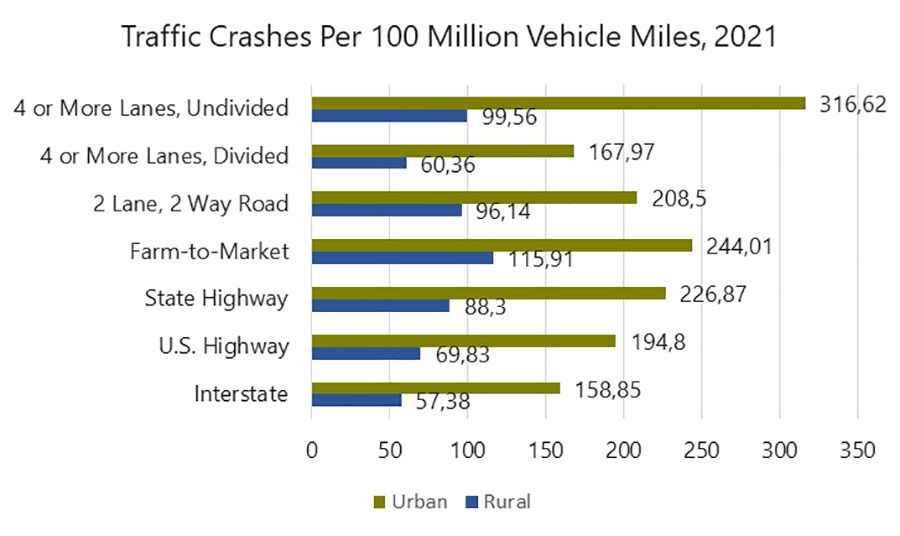
To begin, we wanted to see what the rate of traffic collisions was across the state. We accessed the Texas Department of Transportation (TXDOT) records to obtain this information and organize it in the chart below. To determine the rate at which car crashes occur on different types of roads and highways, we tracked collisions per 100 million vehicle miles travelled in 2021. Since the 2022 calendar year is not yet over, we decided to use the 2021 database, because figures for the full twelve months are available.
Notable takeaways:
- “4 or more lanes, undivided” had by far the highest rate of urban crashes, at 316.62. However, “farm-to-market” highways had a slightly higher rate of rural crashes than “4 or more lanes, undivided” (115.91 to 99.56).
- Compared to the other types of roads in terms of both urban and rural crashes, “interstates” had the least accidents in both categories.
How Many Crashes Occurred in Texas Work Zones in 2021?
As inconvenient as it can be for drivers, occasional construction projects are necessary to maintain the infrastructure of our highways, freeways, and other roads. However, road work frequently has the unintended consequence of causing additional crashes, injuries, and fatalities. This occurs due to many reasons:
- Drivers may be unaware of the construction and not adjust their speed accordingly to account for increased traffic, lane closures, or other roadway obstructions
- Visibility may be decreased in the construction zone due to heavy dust in the air, obstructions, or construction vehicles
- Slow-moving construction vehicles will be entering and existing the work zone
- Traffic patterns may be unpredictable and rights-of-way can be narrower than usual
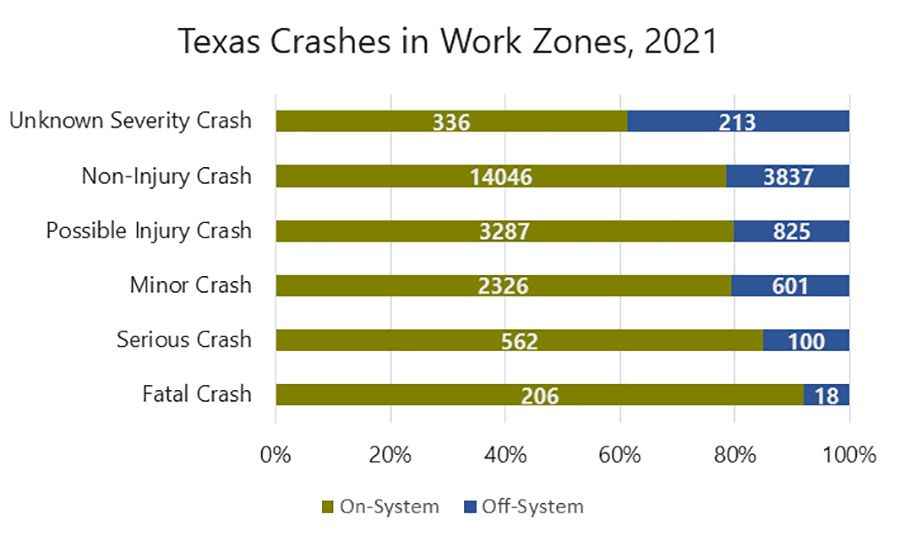
Given the possibility of increased crashes in work zones, we graphed the TXDOT’s data on 2021 work zone construction collisions below. Fortunately, most on-system and off-system crashes in work zones resulted in no injuries (14,046 and 3,837 collisions, respectively) or a minor accident (2,326 and 601 incidents).
Tracking the Impact of Crashes on Bikers & Pedestrians
In a crash between two modern motor vehicles, the drivers and passengers involved are protected by seat belts, airbags, shatter-resistant glass, and precisely designed crumple zones. Unfortunately, pedestrians and bicyclists that are hit by motor vehicles have none of these protections. Even a low-speed impact between a pedestrian or biker and a car, truck, or commercial vehicle can inflict serious injuries on the victim.
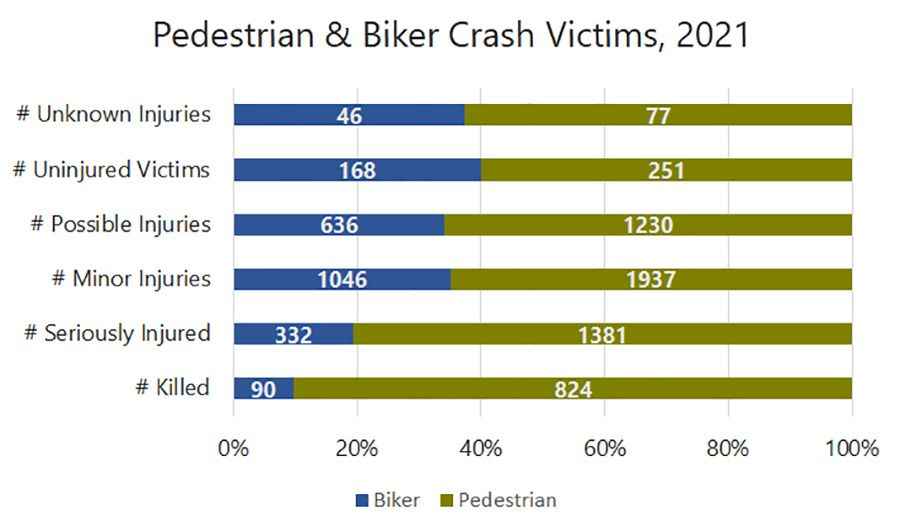
To measure the impact of crashes on bikers and pedestrians in Texas, we graphed the number of injured crash victims according to the severity of their wounds. 2,983 biker and pedestrian crashes resulted in minor injuries, but a further 1,713 collisions resulted in the victim suffering serious wounds. We noticed that pedestrians were approximately 9x as likely to be killed in a Texas crash than a biker.
Fatal Texas Crashes by Month & Road Type
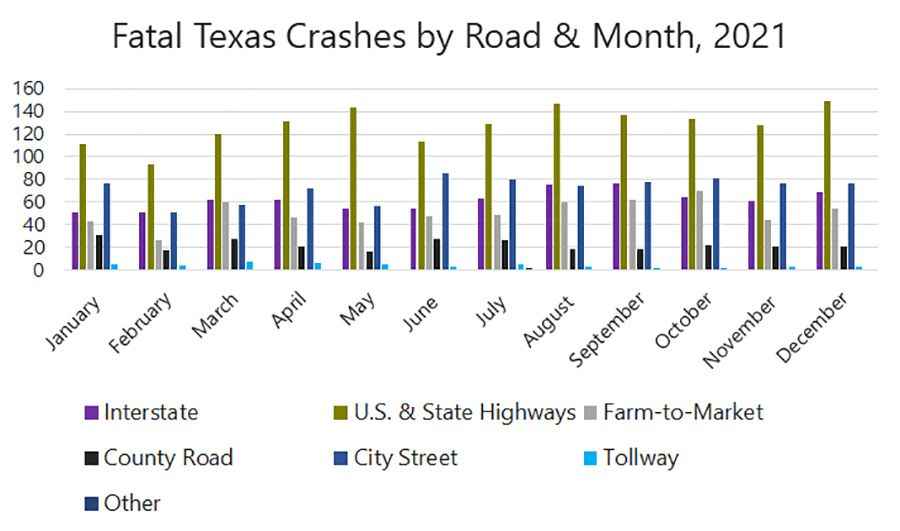
One of the most significant metrics for judging the severity of a crash was whether it resulted in at least one fatality. In 2021, there were 4,060 reported fatal crashes across the state of Texas. The Doan Law Firm reports that these crashes resulted in 4,489 total fatalities. It’s important to note that accidents that were not properly reported to the authorities or recorded correctly in the TXDOT system may not be represented here.
Notable takeaways:
- S. and state highways experienced the most fatal crashes of the seven different road types, with 1,535 lethal collisions over the year
- Texas tollways experienced the least fatal crashes of the tracked road types, with 47 lethal collisions in 2021
- The month of August was the deadliest in terms of fatal car crashes, with 378 recorded collisions
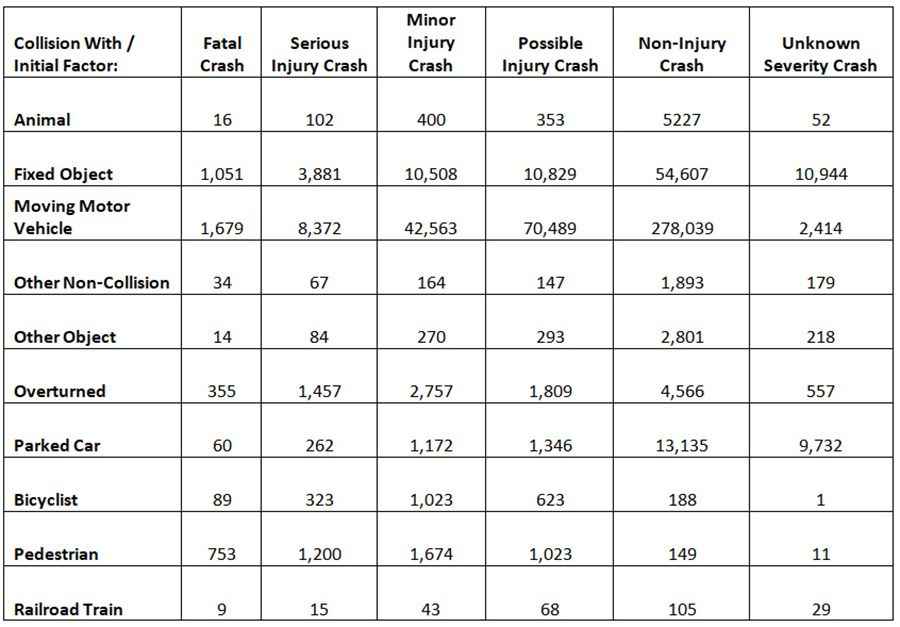
First Harmful Event of a Crash
The “first harmful event” as it pertains to car accidents is the initial factor that caused a crash resulting in property damage or injuries. First harmful events can be a collision (with another vehicle, a fixed barrier, animal, etc.) or other variable, such as a driver losing control and overturning his car. We tracked the known first harmful events of Texas crashes in 2021 in the table below. Most collisions occurred between two moving motor vehicles, with 278,039 non-injury crashes reported over the twelve-month period.
How Has the Rate of Fatal Crashes in Texas Changed Over the Years?
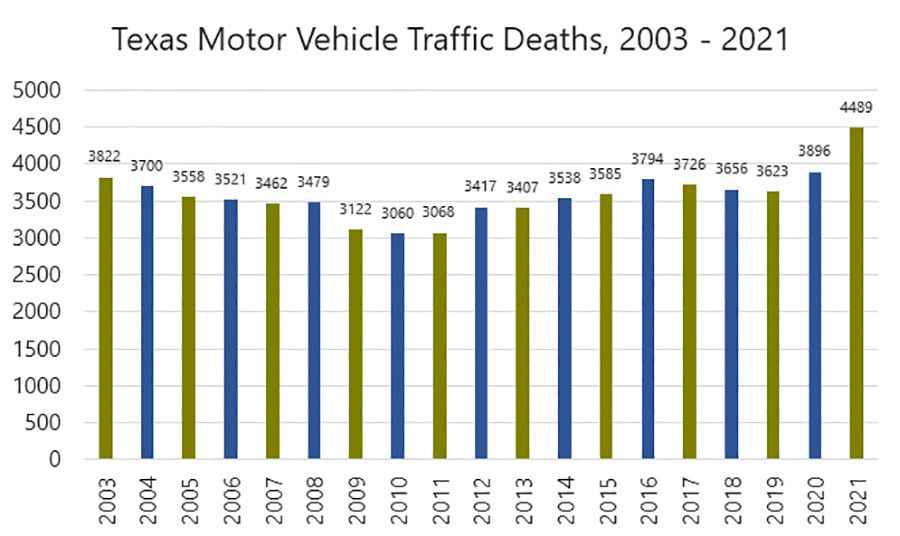
To get a sense of how dangerous Texas has historically been to drive in since the start of the 21st century, we tracked motor vehicle traffic deaths from 2003 to 2021. We noticed that traffic deaths declined over the three-year period from 2009 to 2011, before increasing by 11.38% in 2012. In the following years, the lowest number of reported annual traffic fatalities was 3,407. Despite the onset of the Covid-19 pandemic, traffic deaths did not decrease in 2020 and increased substantially in 2021.
Final Thoughts on Driving in Texas
With a population as large as the state of Texas, some annual traffic accidents are unfortunately inevitable. If you find yourself passing through Texas, be sure to exercise reasonable caution on the roadways and drive defensively to reduce the risk of a collision. By proactively seeking to avoid accidents before they happen, you can keep yourself and your loved ones safe and healthy.